DataScience & Software

Session 1

François Briatte
(small modifs by Kim Antunez & ChatGPT)

2024-01-30

Introduction to datascience

What are quantitative skills?

Statistical skills

  • Exploratory Data Analysis (EDA): The process of summarizing, visualizing, and understanding the main characteristics of a dataset.

  • Descriptive Statistics: Calculating summary measures such as mean, median, and standard deviation.

  • Data Visualization: Creating graphical representations of data to identify patterns and relationships.

  • Standard Statistical Modeling: Using techniques like regression and econometrics to analyze relationships between variables.

  • Machine Learning and Deep Learning: Techniques for building predictive models and artificial intelligence, including neural networks and big data processing.

Data-driven skills

  • Experience with Real-World Data: Ability to work with messy, real-world datasets that might contain noise and inconsistencies.
  • Knowledge of Real-World Measurement Issues: Understanding challenges related to data collection and potential biases.
  • Management of Large, Real-Time Data Pipelines: Dealing with streaming data and efficiently processing large datasets.

Software (and data) engineering

  • Statistical Computing: Using software tools to perform data analysis, statistical modeling, and visualization.
  • Programming: Writing code to manipulate data, build models, and automate tasks. Ensure efficient, maintainable, and scalable code.

Domain-specific statistics

➡️ Applying the quantitative skills mentioned above to specific fields or industries, such as economics, biology, finance, healthcare, etc. This involves tailoring statistical methods to address domain-specific questions and challenges.

Why doing datascience?

Because…

1. Reality is Predictable

Data science allows us to uncover patterns, trends, and relationships within data, enabling us to make informed predictions about future events and outcomes.

Source : https://www.latimes.com

Source : https://www.latimes.com

For instance, this article titled “Predicting Crimes Before They Happen” from the Los Angeles Times explores the concept of predictive policing and how data science techniques are being used to anticipate and prevent crimes before they happen. By examining factors such as location, time of day, weather conditions, and historical crime trends, data scientists can build predictive models and forecast where and when certain types of crimes are more likely to occur.

2. Reality is Visualizable

Data visualization is a powerful tool that translates complex data into visual representations, making it easier to understand and communicate insights to diverse audiences. Visualizations help reveal patterns, outliers, and correlations that might be difficult to grasp from raw data alone.

Source : https://www.bricoleurbanism.org

Source : https://www.bricoleurbanism.org

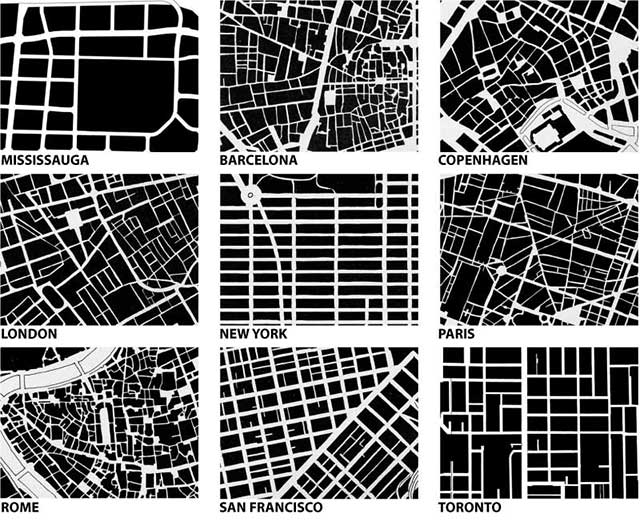
The example from the Bricole Urbanism project provides insights into the spatial arrangement and characteristics of urban areas. Through data visualization techniques, urban data such as building footprints, street layouts, and land use can be transformed into interactive maps and visualizations.

3. Reality is Multidimensional

Many real-world phenomena are influenced by multiple factors and variables. Data science allows us to analyze multidimensional data to uncover hidden relationships and dependencies. Techniques like clustering and dimensionality reduction help us gain insights from high-dimensional data.

Source : https://www.last.fm

Source : https://www.last.fm

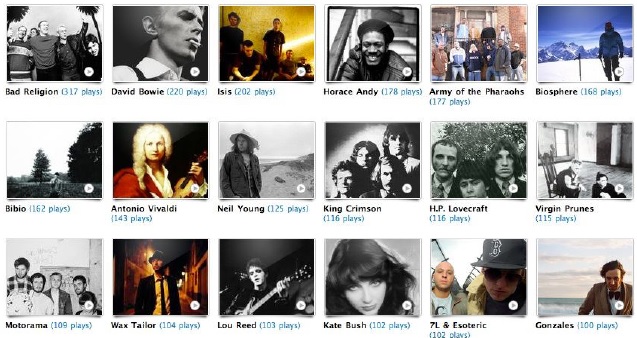
The example from the Last.fm user library exemplifies the depth of multidimensional data exploration. The diverse facets of music listening habits can be analyzed through data points which include genres, artists, albums, play counts, timestamps, and more.

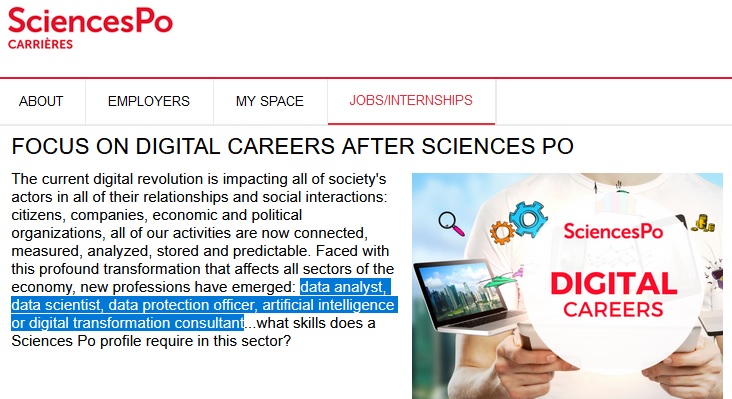
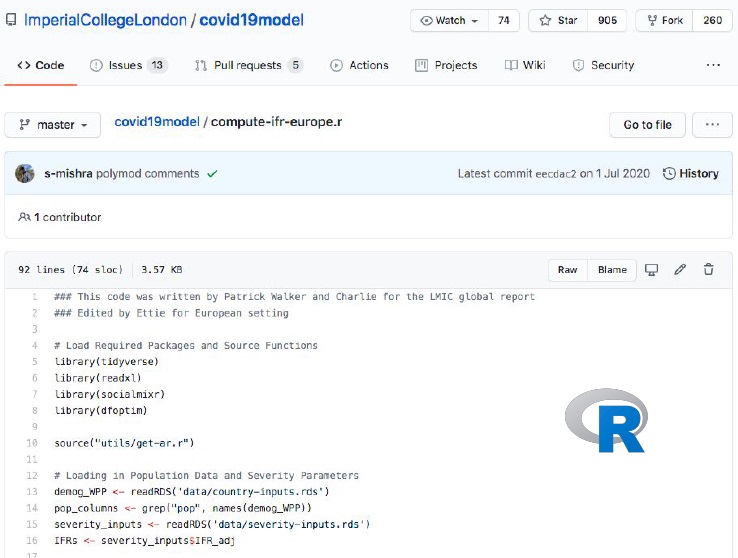
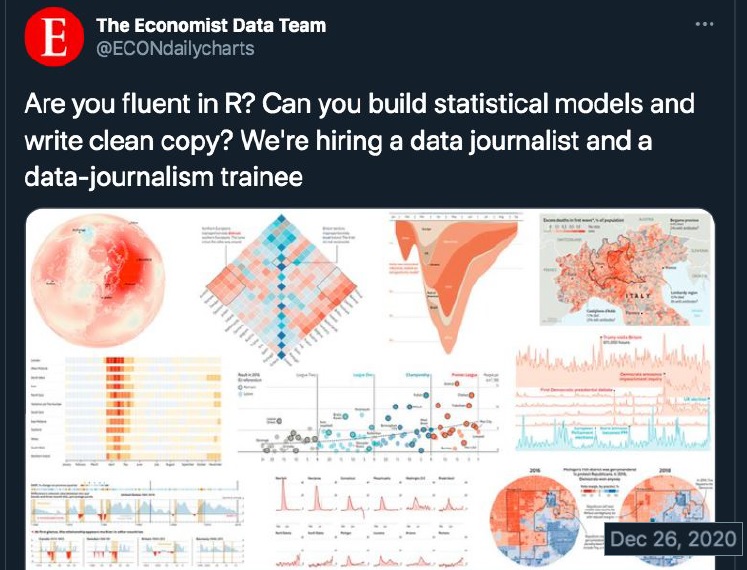
4. Data and quantitative Skills are professional assets

The ability to work with data, analyze it, and extract insights has become a sought-after skill in many professions. Quantitative skills, including statistical analysis, machine learning, and programming, are in high demand across industries. Data-driven decision-making leads to improved strategies, better customer experiences, and optimized operations.
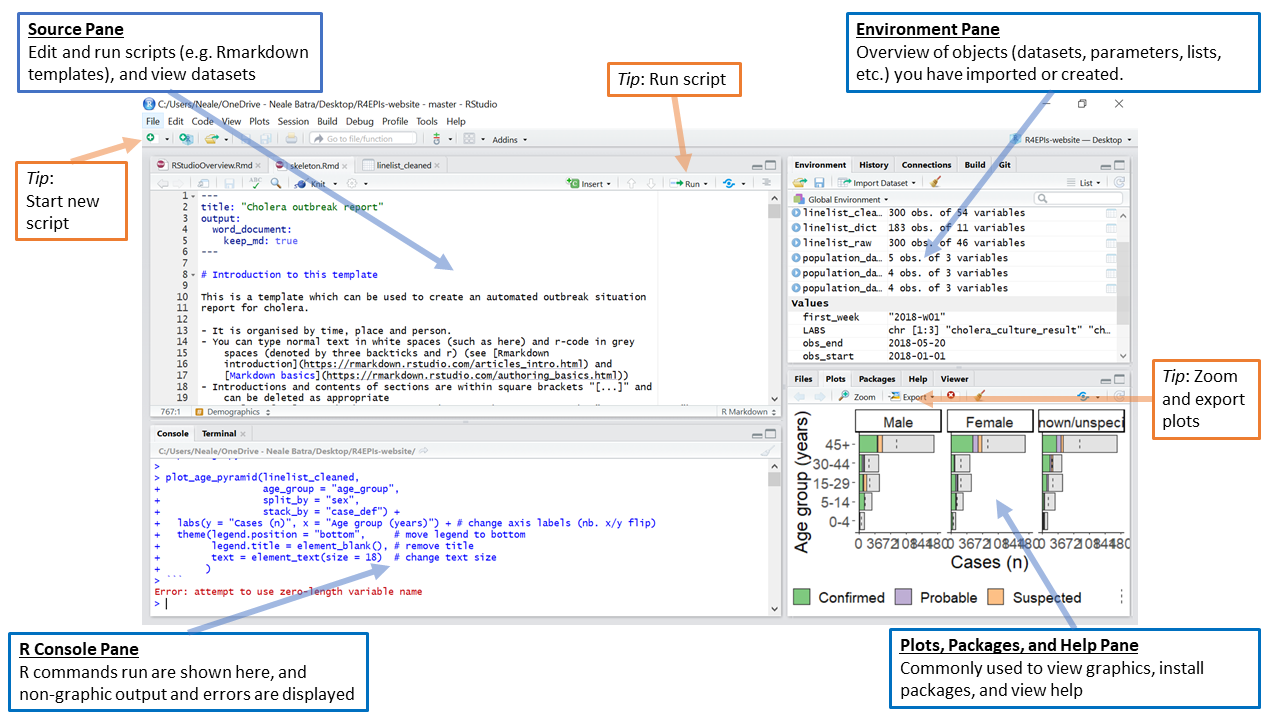
Source : https://carrieres.sciencespo.fr/

Source : https://carrieres.sciencespo.fr/

About the course

Provisional schedule

  1. DataScience and Software
  2. Workflow
  3. Data 1/2
  4. Data 2/2
  5. Datavisualization
  6. Univariate Exploratory analysis
  1. Bivariate Exploratory analysis
  2. Statistical inference
  3. Linear regression
  4. Logistic regression
  5. Spatial Data and Cartography
  6. Classification

Other possibilities:

  • Time series OR Obtaining data
  • API and webscrapping

On the menu

  • This course is a practical workshop, not a lecture

  • Form groups of 3 students before next week

  • Get ready to work together

  • Plan ahead to be able to do readings between lessons

  • Grading will happen through group coding exercises

R and RStudio

Introduction to R and RStudio

There are many statistical programming languages:

  • Python
  • SPSS
  • Julia
  • Stata

All fundamentally differ from spreadsheet editors such as Excel

R Software

is a statistical programming language and software environment for statistical computing and graphics.

It’s popularity in data science is due to:

  • its open-source nature (R & RStudio)
  • its extensive libraries
  • data manipulation capabilities
  • statistical analysis tools
  • its active user community

RStudio

is an integrated development environment (IDE) specifically designed for R programming.

It provides a user-friendly interface for writing, executing, and managing R code :

  • code autocompletion
  • variable exploration
  • integrated plotting

Source : https://www.youtube.com

Source : https://www.youtube.com

Source : https://github.com/ImperialCollegeLondon

Source : https://github.com/ImperialCollegeLondon

Source : https://twitter.com/ECONdailycharts

Source : https://twitter.com/ECONdailycharts

Computing Requirements for the Course

  • Usable Computer Make sure you have access to a functional computer, preferably a laptop or desktop. Mobile devices like smartphones and tablets won’t suffice for the demands of data science work.

  • Hardware Specifications: While Microsoft Surfaces and Google Chromebooks are compatible, ensure your computer has a reasonable amount of disk space and ample memory (RAM). Close unused software and browser tabs to optimize performance.

  • Desktop Organization: Keep your desktop and windows clutter-free to create a focused and organized workspace.

  • Power Source: Connect your computer to a power source to avoid interruptions during your learning sessions.

  • Internet Connection: A stable and fast internet connection is crucial for accessing online resources, downloading software, and participating in interactive activities.

Software Requirements for the Course

  • Operating System and Web Browsers up-to-date. For Mac users, macOS 11 or newer is recommended, and for Windows users, Windows 10 or newer is preferred. Google Chrome and Mozilla Firefox offer compatibility with various online tools and platforms used in data science.
  • Download and install R : a popular programming language used in statistical computing and data analysis. Visit the R Project website and choose the appropriate download page for your operating system (Mac or Windows).

  • Download and install RStudio (IDE) : Install RStudio, an integrated development environment (IDE) designed for R programming. Visit the posit website and download the RStudio Desktop version.

Troubleshooting

  • (Mac) If RStudio keeps asking for git, download and install it sourceforge.net/projects/git-osx-installer
  • (Win) If you cannot find RStudio, follow the path below C drive → Program Files → RStudio → bin → rstudio.exe
  • (Win) If later on you cannot install packages, run as admin RStudio → right-click on icon → Run as administrator
  • (Win) If asked between 32-bit and 64-bit, select 64-bit Please report any other issue right now

Practice session

Overview of the RStudio Interface: Console, Scripts, Environment, Plots, Help, Files…

Source : https://r4epis.netlify.app/training/r_basics

  • Select File → New R Script (Ctrl/Cmd-Shift-N)

  • Save the script (somewhere you remember) as hello.r (for future use)

  • Try the followings. Press Ctrl-Enter (Win) or Cmd-Enter (Mac) to execute / run

# Adding a text before a # is a comment
# function(arguments)
print("hello world!")

# object assignment
x <- seq(0, 100, by = 25)
x

R packages are essential for additional functionalities. Lots of them are on the CRAN (Comprehensive R Archive Network)

# install a package from the CRAN (required only once)
install.packages("stringr")

# you now have access to lots of new functions
?stringr::str_detect

# package::function(arguments)
txt <- c("apple", "banana", "pear", "pineapple")
stringr::str_detect(txt, "p")

# load a package (in every script where needed)
library(stringr)

Well done! You have just executed / ran your first script

Homework for next week

Your goal: get familiar with RStudio

Also: gather in groups of 3 and mention your group here