setwd("C:/Desktop/DSR/Session 2")Exercise 1 : Cholera deaths in London, 1854
Session 2
Download datasets on your computer
Put them a subfolder called data in your working directory.
Load data
First, set your working directory:
Then, use the read.csv function to load the 3 following datasets and use the head function to preview them.
repository <- "data"To understand what does the paste0 function does, do:
?paste0It concatenates 2 strings, below the subfolder data with the names of the datasets, separated with \.
# read in the cholera deaths data
fatalities <- read.csv(paste0(repository, "/cholera-fatalities.csv"))
### Equivalent to
# fatalities <- read.csv("data/cholera-fatalities.csv")
head(fatalities)
case x y
1 1 13.588010 11.095600
2 2 9.813148 12.502140
3 3 14.695020 10.126840
4 4 15.220570 9.993003
5 5 13.162650 12.963190
6 6 13.778030 8.864945# read in the London streets data
streets <- read.csv(paste0(repository, "/cholera-streets.csv"))
head(streets) street n x y
1 1 2 16.73800 18.69600
2 1 2 17.66000 18.71200
3 2 2 14.46200 18.65500
4 2 2 16.73800 18.69600
5 3 2 12.79388 18.61613
6 3 2 14.46200 18.65500# read in the water pumps data
pumps <- read.csv(paste0(repository, "/cholera-pumps.csv"))
head(pumps) pump label x y
1 1 Oxford Market 8.651201 17.89160
2 2 Castle St E 10.984780 18.51785
3 3 Oxford St #1 13.378190 17.39454
4 4 Oxford St #2 14.879830 17.80992
5 5 Gt Marlborough 8.694768 14.90547
6 6 Crown Chapel 8.864416 12.75354Explore the datasets
Clue
Use nrow(dataset).
Solution
nrow(fatalities)[1] 578
Clue 1
Use install.packages(library).
Clue 2
Use library(library).
Solution
install.packages("ggplot2")library(ggplot2)Look how you plot the streets
ggplot() +
  geom_line(data = streets, aes(x = x, y = y, group = street)) +
  coord_equal()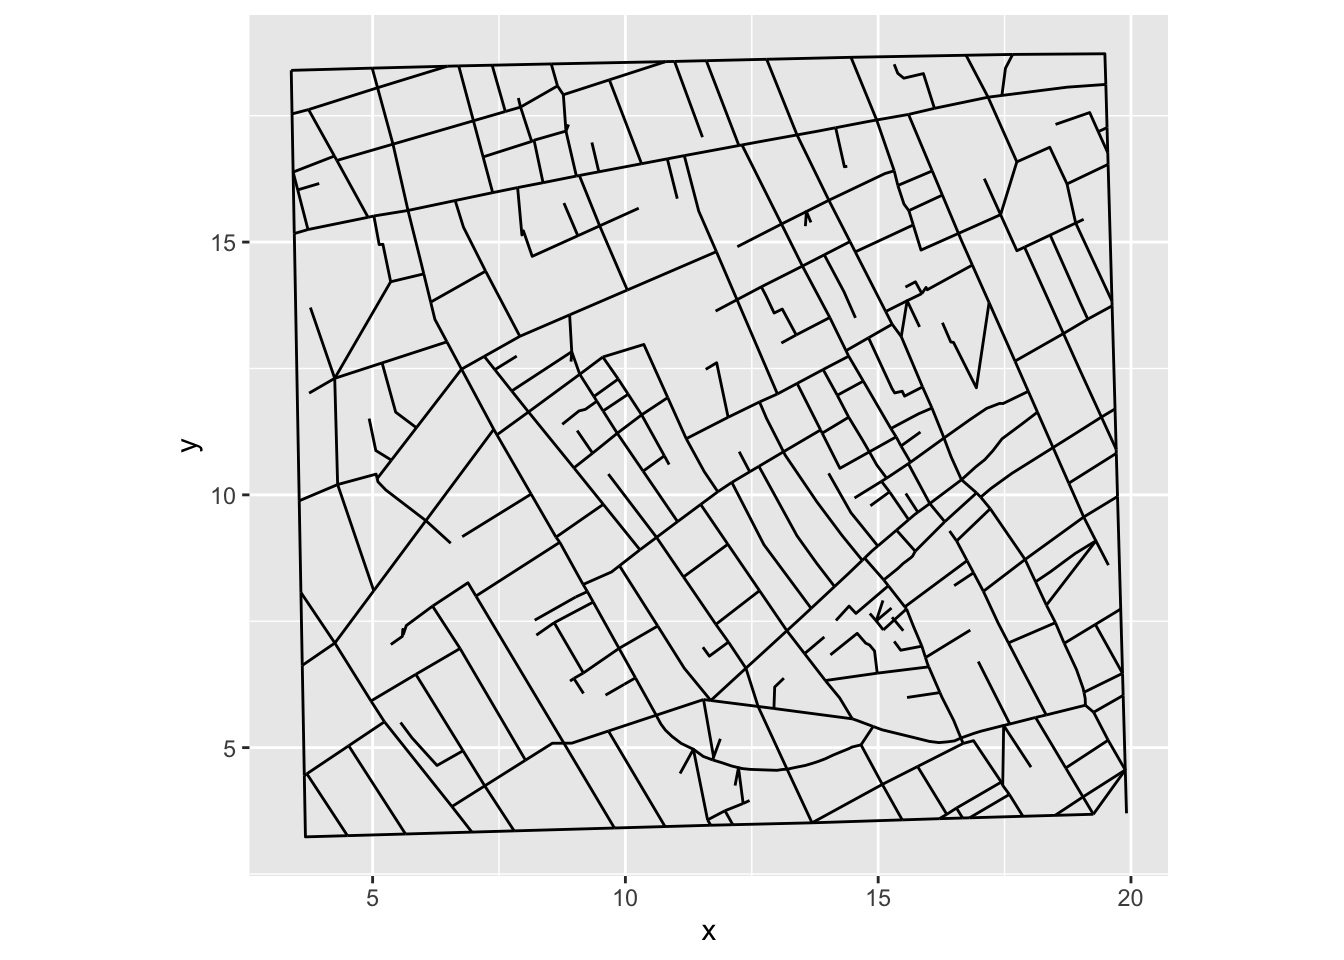
Clue
Use ggplot2::geom_point function. Look at the color parameter to print them in red.
Solution
ggplot() +
  geom_line(data = streets, aes(x = x, y = y, group = street)) +
  geom_point(data = fatalities, aes(x = x, y = y), color = "red") +
  coord_equal()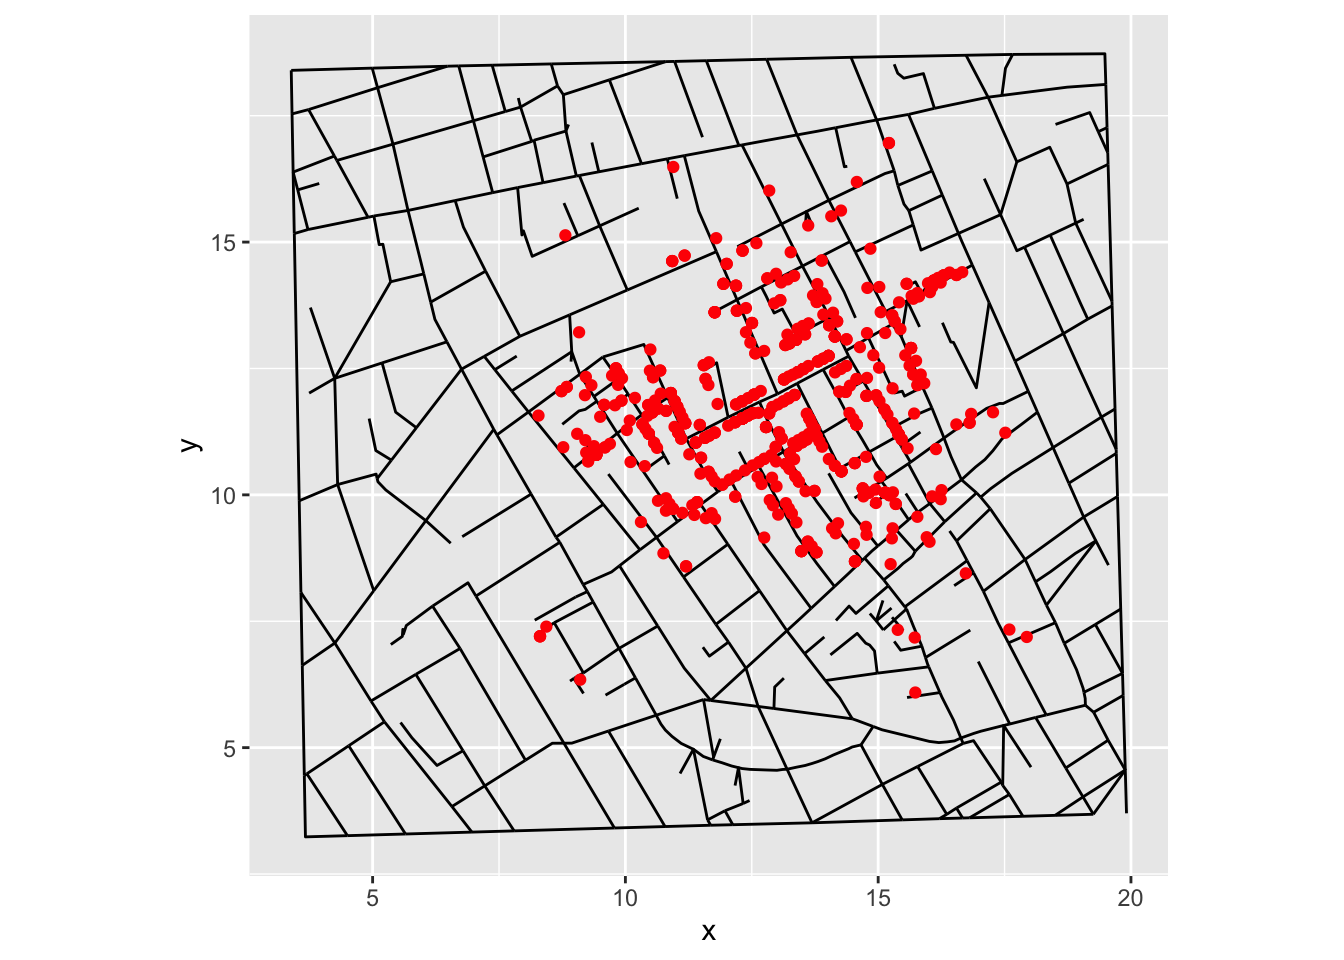
Clue
Use another ggplot2::geom_point function and try different parameters such as color, size and alpha
Solution
p <- ggplot() +
  geom_line(data = streets, aes(x = x, y = y, group = street)) +
  geom_point(data = fatalities, aes(x = x, y = y), color = "red") +
  geom_point(data = pumps, aes(x = x, y = y),
             color = "green", size = 10, alpha = 1/2) +
  coord_equal()
p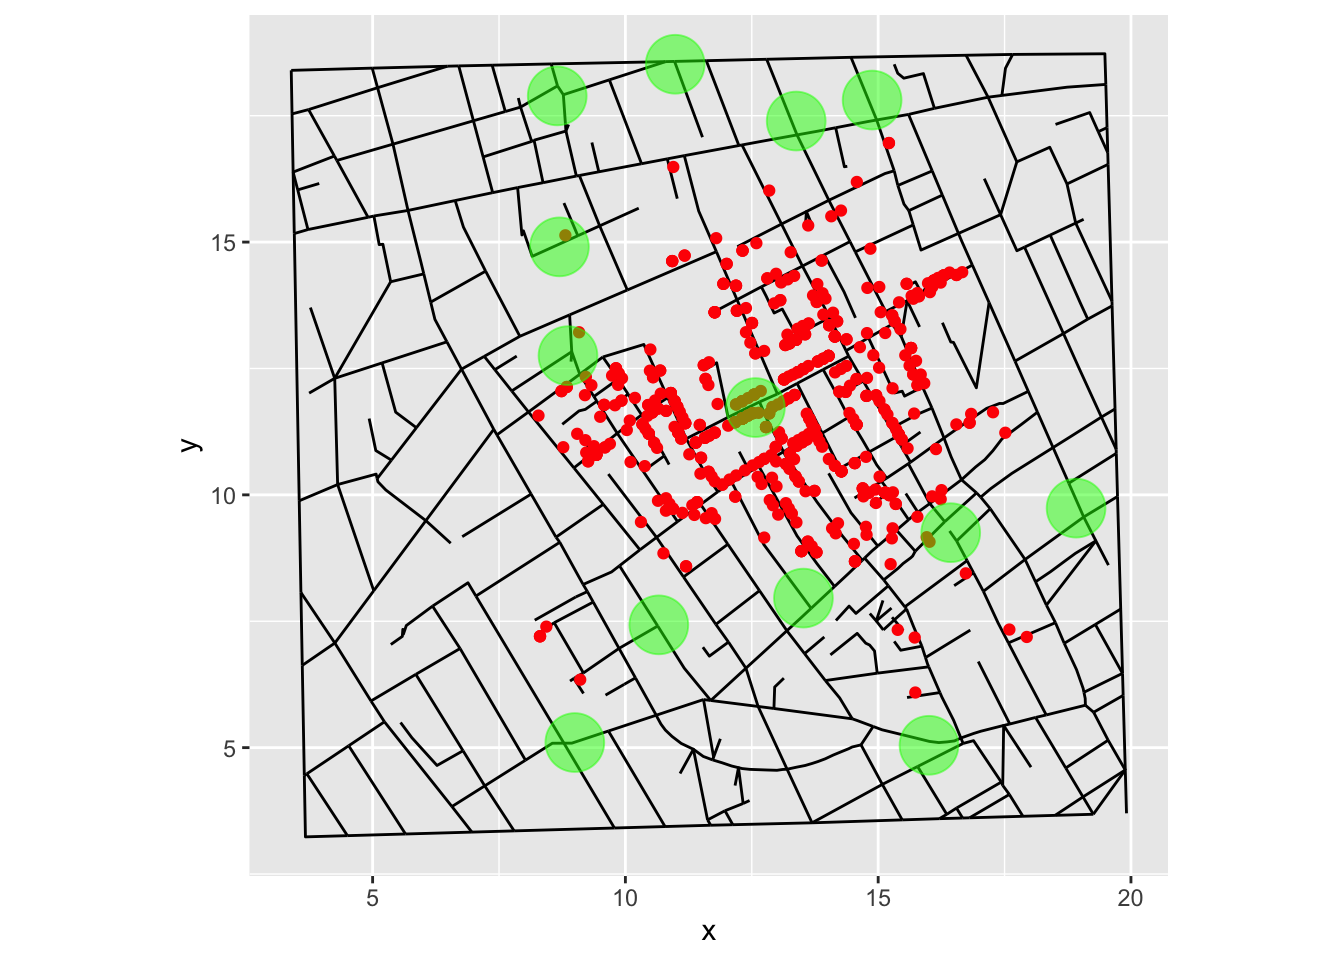
Bonus
Look how to remove extra plot elements
p +
  theme_void()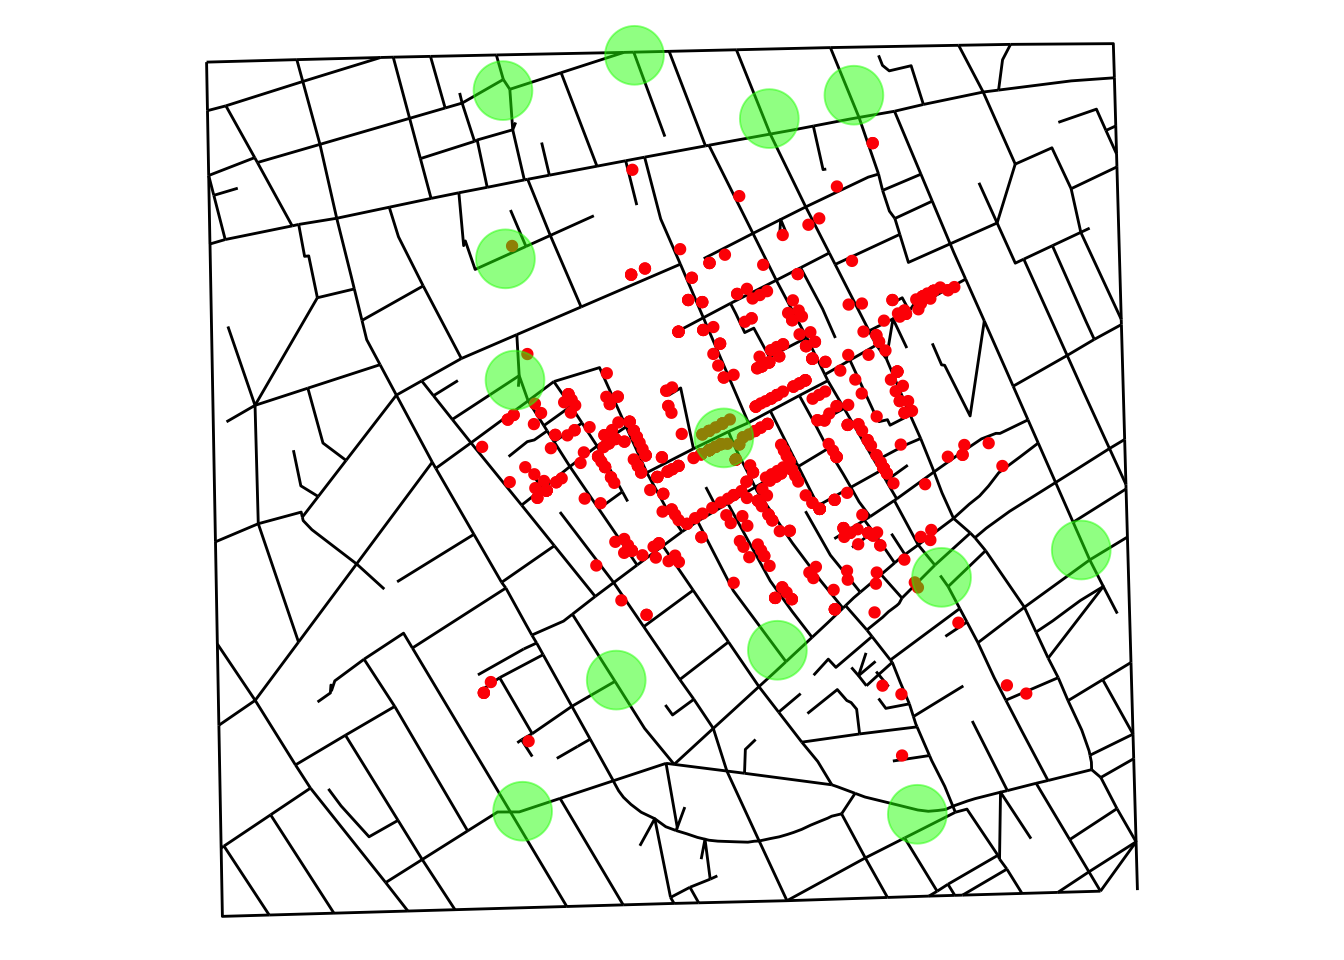
Source
Inspiration
https://freakonometrics.hypotheses.org/tag/cholera
Data sources
- Fatalities: https://cran.r-project.org/package=cholera (fatalities.unstacked)
- Streets and pumps: https://cran.r-project.org/package=HistData (Snow.streets and Snow.pumps)