library(tidyverse) # {dplyr}, {ggplot2}, {readxl}, {stringr}, {tidyr}, etc.Preparation: Mapping life expectancy worldwide
For Session 9
Download datasets on your computer
Step 1: Load data and install useful packages
library(sf) # for geographical datasetsLinking to GEOS 3.11.0, GDAL 3.5.3, PROJ 9.1.0; sf_use_s2() is TRUErepository <- "data"# import the shapefile
geo <- sf::st_read(paste0(repository, "/WB_countries_Admin0_lowres.geojson"))Reading layer `WB_countries_Admin0_lowres' from data source
`https://minio.lab.sspcloud.fr/kantunez/diffusion/dsr/WB_countries_Admin0_lowres.geojson'
using driver `GeoJSON'
Simple feature collection with 251 features and 53 fields
Geometry type: MULTIPOLYGON
Dimension: XY
Bounding box: xmin: -180 ymin: -59.47194 xmax: 180 ymax: 83.6341
Geodetic CRS: WGS 84# the data look like a data frame, but contain spatial geometries
glimpse(geo)Rows: 251
Columns: 54
$ FID <int> 0, 1, 2, 3, 4, 5, 6, 7, 8, 9, 10, 11, 12, 13, 14, 15, 16, 1…
$ OBJECTID <int> 1, 2, 3, 4, 5, 6, 7, 8, 9, 10, 11, 12, 13, 14, 15, 16, 17, …
$ featurecla <chr> "Admin-0 country", "Admin-0 country", "Admin-0 country", "A…
$ LEVEL <int> 2, 2, 2, 2, 2, 2, 2, 2, 2, 2, 2, 2, 2, 2, 2, 2, 2, 2, 2, 2,…
$ TYPE <chr> "Sovereign country", "Sovereign country", "Sovereign countr…
$ FORMAL_EN <chr> "Republic of Indonesia", "Malaysia", "Republic of Chile", "…
$ FORMAL_FR <chr> " ", " ", " ", " ", " ", " ", " ", " ", " ", " ", " ", " ",…
$ POP_EST <int> 260580739, 31381992, 17789267, 11138234, 31036656, 44293293…
$ POP_RANK <int> 17, 15, 14, 14, 15, 15, 12, 18, 18, 13, 12, 13, 17, 14, 13,…
$ GDP_MD_EST <dbl> 3028000.00, 863000.00, 436100.00, 78350.00, 410400.00, 8794…
$ POP_YEAR <int> 2017, 2017, 2017, 2017, 2017, 2017, 2017, 2017, 2017, 2017,…
$ LASTCENSUS <int> 2010, 2010, 2002, 2001, 2007, 2010, 2001, 2011, 2010, 2009,…
$ GDP_YEAR <int> 2016, 2016, 2016, 2016, 2016, 2016, 2016, 2016, 2016, 2016,…
$ ECONOMY <chr> "4. Emerging region: MIKT", "6. Developing region", "5. Eme…
$ INCOME_GRP <chr> "4. Lower middle income", "3. Upper middle income", "3. Upp…
$ FIPS_10_ <chr> "ID", "MY", "CI", "BL", "PE", "AR", "CY", "IN", "CH", "-99"…
$ ISO_A2 <chr> "ID", "MY", "CL", "BO", "PE", "AR", "CY", "IN", "CN", "IL",…
$ ISO_A3 <chr> "IDN", "MYS", "CHL", "BOL", "PER", "ARG", "CYP", "IND", "CH…
$ ISO_A3_EH <chr> "IDN", "MYS", "CHL", "BOL", "PER", "ARG", "CYP", "IND", "CH…
$ ISO_N3 <chr> "360", "458", "152", "068", "604", "032", "196", "356", "15…
$ UN_A3 <chr> "360", "458", "152", "068", "604", "032", "196", "356", "15…
$ WB_A2 <chr> "ID", "MY", "CL", "BO", "PE", "AR", "CY", "IN", "CN", "IL",…
$ WB_A3 <chr> "IDN", "MYS", "CHL", "BOL", "PER", "ARG", "CYP", "IND", "CH…
$ CONTINENT <chr> "Asia", "Asia", "South America", "South America", "South Am…
$ REGION_UN <chr> "Asia", "Asia", "Americas", "Americas", "Americas", "Americ…
$ SUBREGION <chr> "South-Eastern Asia", "South-Eastern Asia", "South America"…
$ REGION_WB <chr> "East Asia & Pacific", "East Asia & Pacific", "Latin Americ…
$ NAME_AR <chr> "?????????", "???????", "?????", "???????", "????", "??????…
$ NAME_BN <chr> "????????????", "???????????", "????", "????????", "????", …
$ NAME_DE <chr> "Indonesien", "Malaysia", "Chile", "Bolivien", "Peru", "Arg…
$ NAME_EN <chr> "Indonesia", "Malaysia", "Chile", "Bolivia", "Peru", "Argen…
$ NAME_ES <chr> "Indonesia", "Malasia", "Chile", "Bolivia", "Perú", "Argent…
$ NAME_FR <chr> "Indonésie", "Malaisie", "Chili", "Bolivie", "Pérou", "Arge…
$ NAME_EL <chr> "?????????", "????????", "????", "???????", "?????", "?????…
$ NAME_HI <chr> "??????????", "???????", "????", "????????", "????", "?????…
$ NAME_HU <chr> "Indonézia", "Malajzia", "Chile", "Bolívia", "Peru", "Argen…
$ NAME_ID <chr> "Indonesia", "Malaysia", "Chili", "Bolivia", "Peru", "Argen…
$ NAME_IT <chr> "Indonesia", "Malesia", "Cile", "Bolivia", "Perù", "Argenti…
$ NAME_JA <chr> "??????", "?????", "??", "????", "???", "??????", "????", "…
$ NAME_KO <chr> "?????", "?????", "??", "????", "??", "?????", "????", "??"…
$ NAME_NL <chr> "Indonesië", "Maleisië", "Chili", "Bolivia", "Peru", "Argen…
$ NAME_PL <chr> "Indonezja", "Malezja", "Chile", "Boliwia", "Peru", "Argent…
$ NAME_PT <chr> "Indonésia", "Malásia", "Chile", "Bolívia", "Peru", "Argent…
$ NAME_RU <chr> "?????????", "????????", "????", "???????", "????", "??????…
$ NAME_SV <chr> "Indonesien", "Malaysia", "Chile", "Bolivia", "Peru", "Arge…
$ NAME_TR <chr> "Endonezya", "Malezya", "?ili", "Bolivya", "Peru", "Arjanti…
$ NAME_VI <chr> "Indonesia", "Malaysia", "Chile", "Bolivia", "Peru", "Argen…
$ NAME_ZH <chr> "?????", "????", "??", "????", "??", "???", "????", "??", "…
$ WB_NAME <chr> "Indonesia", "Malaysia", "Chile", "Bolivia", "Peru", "Argen…
$ WB_RULES <chr> "None", "None", "None", "None", "None", "None", "None", "St…
$ WB_REGION <chr> "EAP", "EAP", "LCR", "LCR", "LCR", "LCR", "ECA", "SOA", "EA…
$ Shape_Leng <dbl> 495.029918, 68.456913, 416.997272, 54.345991, 73.262192, 15…
$ Shape_Area <dbl> 153.0786077, 26.7031722, 76.7618126, 92.2035874, 106.417089…
$ geometry <MULTIPOLYGON [°]> MULTIPOLYGON (((117.7036 4...., MULTIPOLYGON (…# import life expectancy
lexp <- readr::read_tsv(paste0(repository, "/life-expectancy.tsv"))Rows: 259 Columns: 5
── Column specification ────────────────────────────────────────────────────────
Delimiter: "\t"
chr (3): country, iso2c, iso3c
dbl (2): year, SP.DYN.LE00.IN
ℹ Use `spec()` to retrieve the full column specification for this data.
ℹ Specify the column types or set `show_col_types = FALSE` to quiet this message.glimpse(lexp)Rows: 259
Columns: 5
$ country <chr> "Africa Eastern and Southern", "Africa Western and Cent…
$ iso2c <chr> "ZH", "ZI", "1A", "S3", "B8", "V2", "Z4", "4E", "T4", "…
$ iso3c <chr> "AFE", "AFW", "ARB", "CSS", "CEB", "EAR", "EAS", "EAP",…
$ year <dbl> 2020, 2020, 2020, 2020, 2020, 2020, 2020, 2020, 2020, 2…
$ SP.DYN.LE00.IN <dbl> 63.31386, 57.22637, 70.92336, 72.57488, 76.14403, 70.03…Step 2: CRS projections and bounding boxes
Look how you do a world map, with land and country administrative borders.
ggplot(geo) +
  geom_sf() +
  coord_sf(crs = 4326)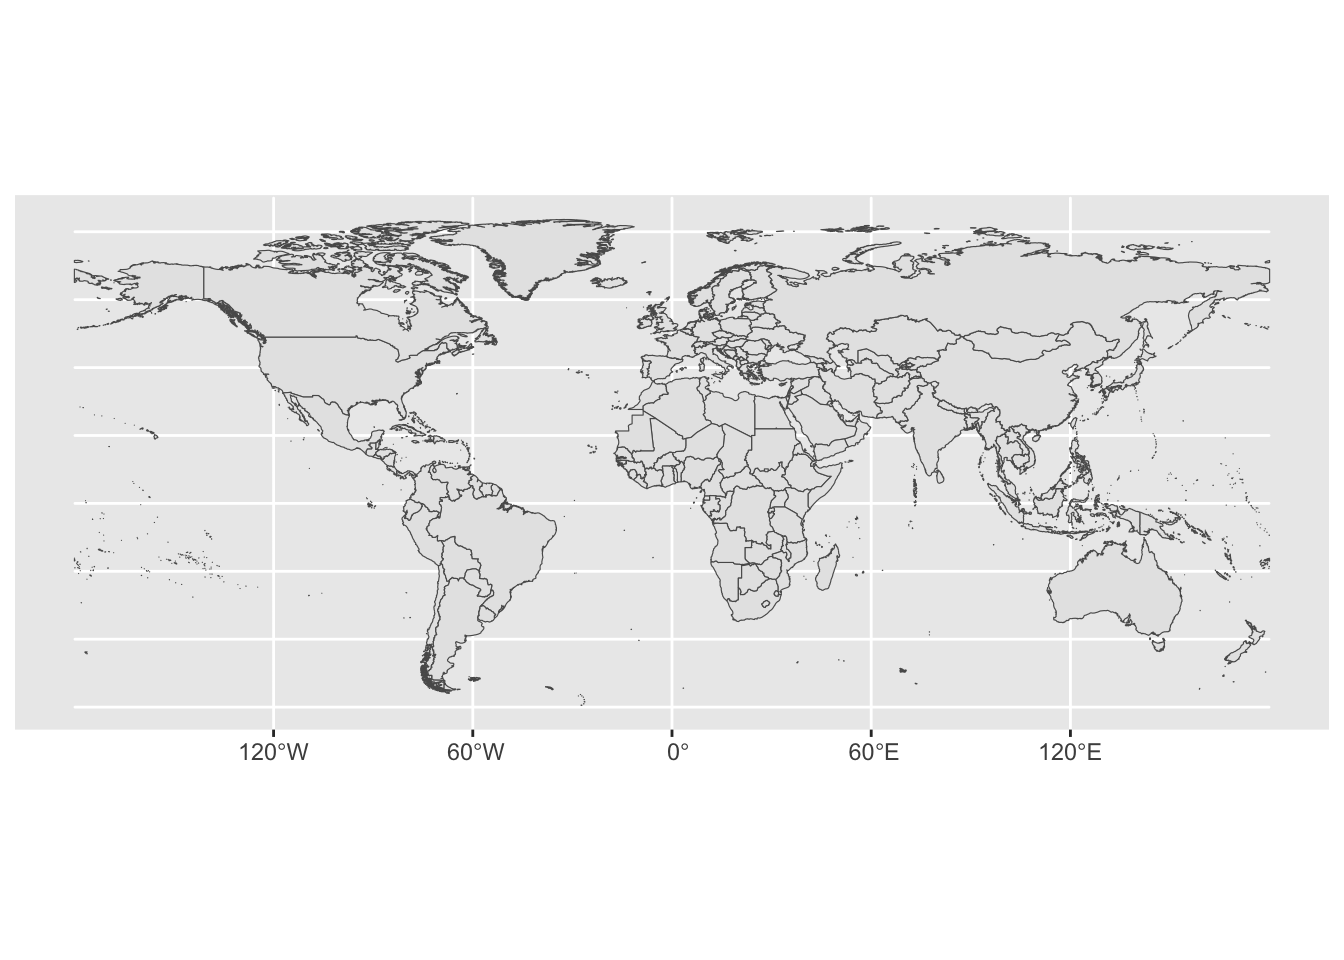
The previous plot uses the standard WGS84 CRS projection:
sf::st_crs(geo)Coordinate Reference System:
User input: WGS 84
wkt:
GEOGCRS["WGS 84",
DATUM["World Geodetic System 1984",
ELLIPSOID["WGS 84",6378137,298.257223563,
LENGTHUNIT["metre",1]]],
PRIMEM["Greenwich",0,
ANGLEUNIT["degree",0.0174532925199433]],
CS[ellipsoidal,2],
AXIS["geodetic latitude (Lat)",north,
ORDER[1],
ANGLEUNIT["degree",0.0174532925199433]],
AXIS["geodetic longitude (Lon)",east,
ORDER[2],
ANGLEUNIT["degree",0.0174532925199433]],
ID["EPSG",4326]]This is how you find the ‘bounding box’ (min/max lat/lon coordinates) of Denmark:
geo %>%
  filter(NAME_EN == "Denmark") %>%
  sf::st_bbox()
xmin ymin xmax ymax
8.095225 54.568590 15.151378 57.743842 And how you define it manually:
ggplot(geo %>% filter(NAME_EN == "Denmark")) +
  geom_sf() +
  coord_sf(ylim = c(54.6, 57.8), # y = latitude = horizontal
           xlim = c(8.1, 15.2))  # x = longitude = vertical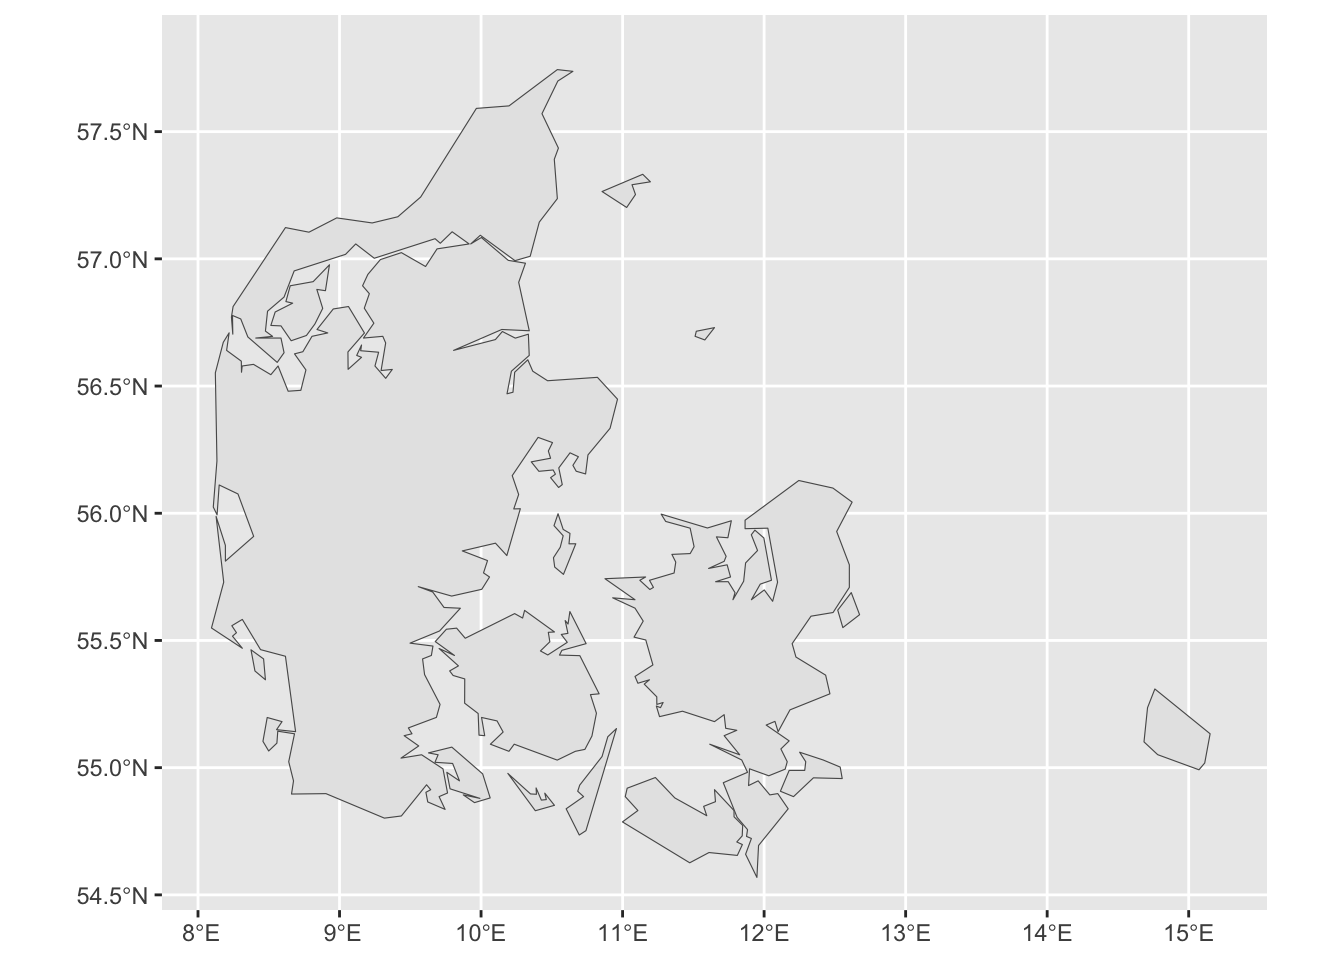
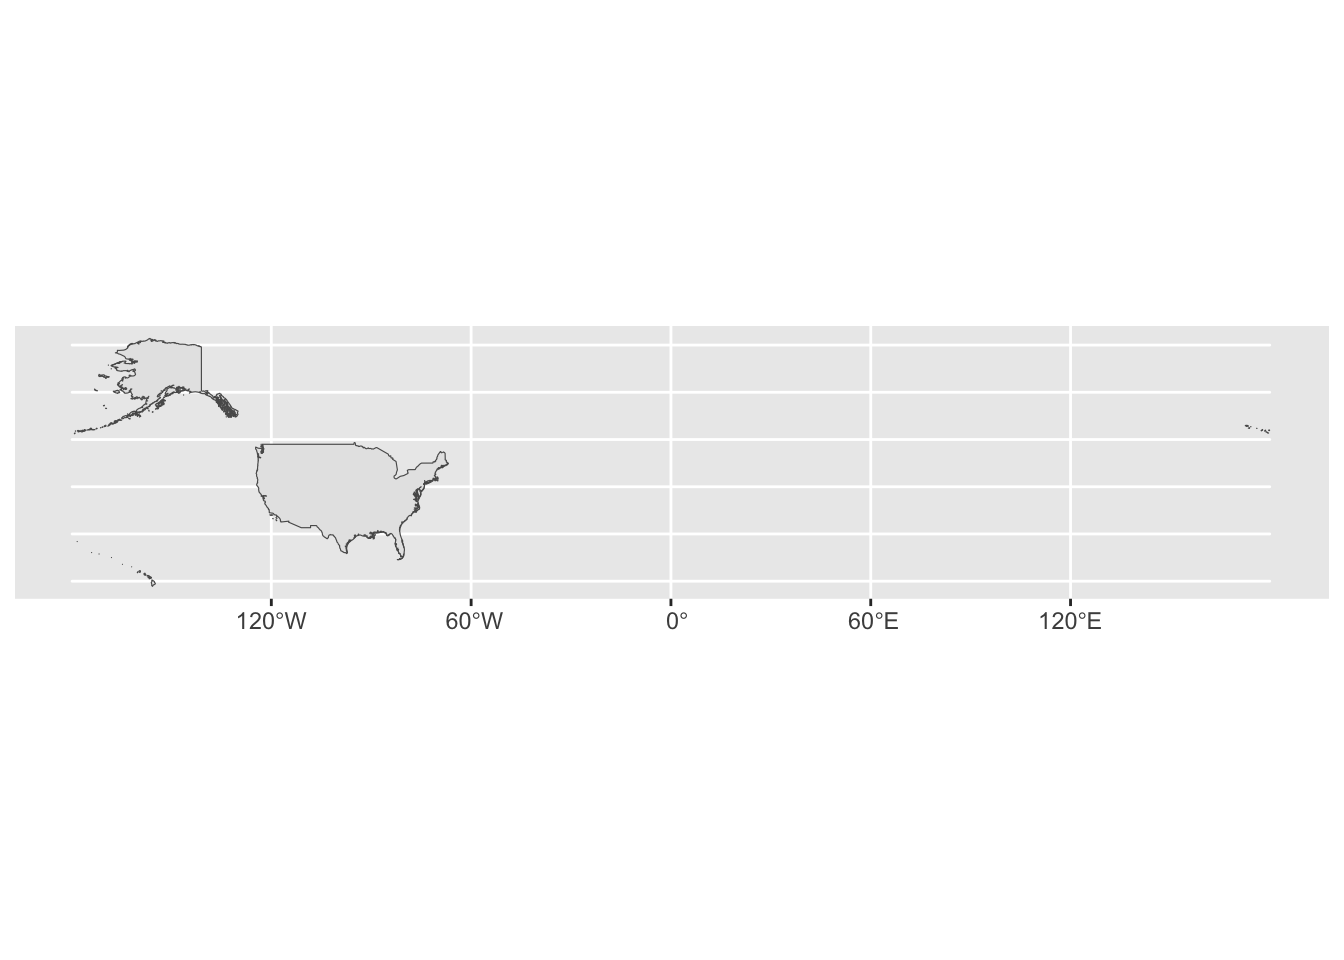
Question 1
Plot the U.S with its default projection:
Clue
dplyr::filter by the adapted NAME_EN
Solution
ggplot(geo %>%
         filter(NAME_EN == "United States of America")) +
  geom_sf()
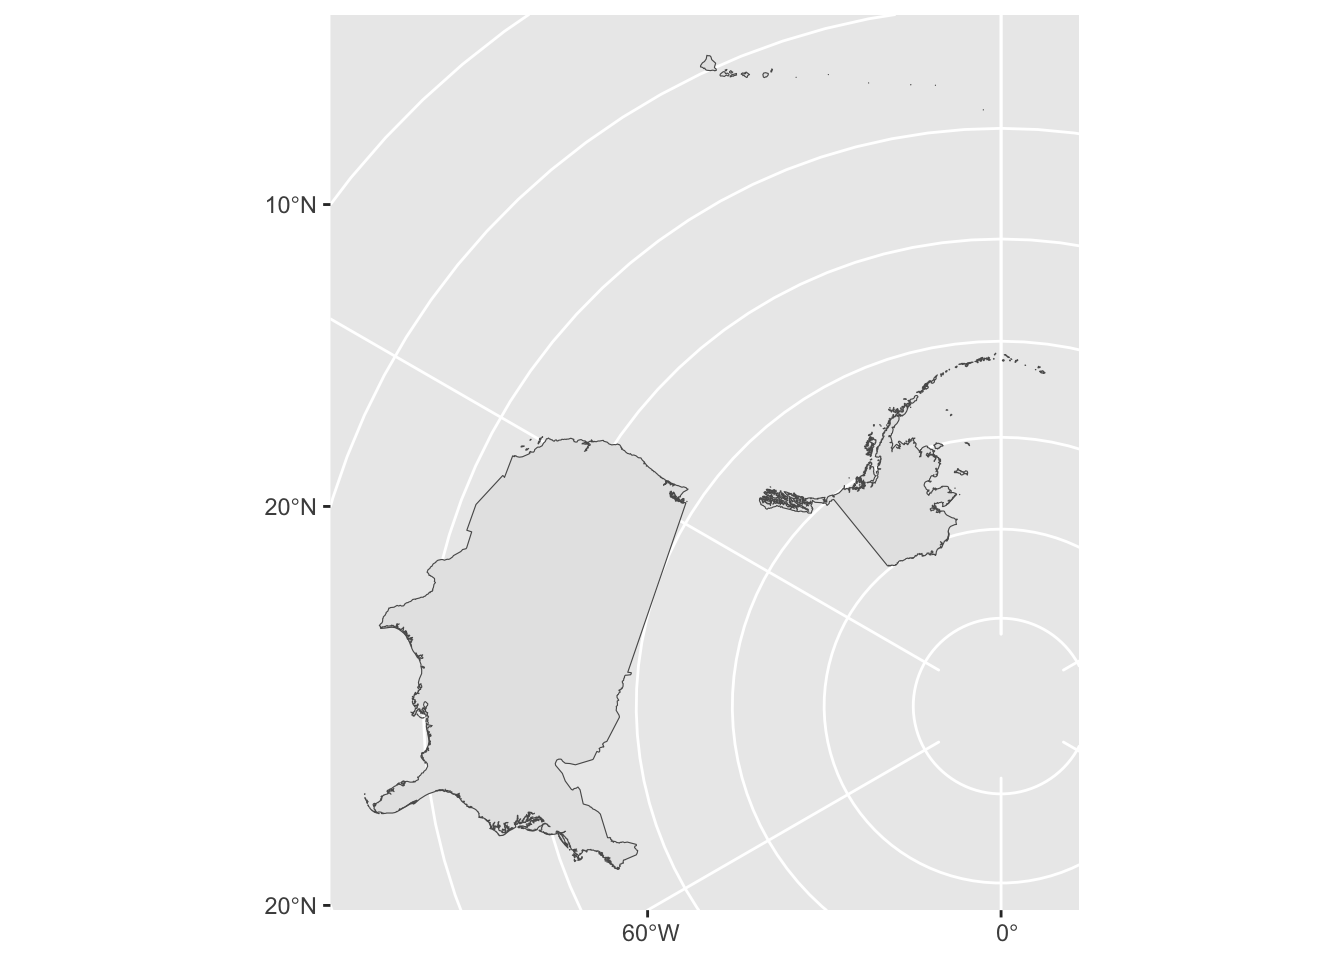
Question 2
Transform the previous plot using the Arctic Polar Stereographic projection corresponding to crs = "EPSG:3995:
Clue
Use sf::st_transform.
Solution
ggplot(geo %>%
         filter(NAME_EN == "United States of America") %>%
         sf::st_transform(crs = "EPSG:3995")) +
  geom_sf()
Step 3: merged dataset
Clue
Use dplyr::full_join.
Solution
# sanity check: only one measure per country
any(duplicated(lexp$country))
[1] FALSE# merge to geographic data (after exploring the country codes a bit...)
d <- full_join(geo, lexp, by = c("WB_A3" = "iso3c"))
head(d)Simple feature collection with 6 features and 57 fields
Geometry type: MULTIPOLYGON
Dimension: XY
Bounding box: xmin: -109.4513 ymin: -55.9185 xmax: 140.9772 ymax: 7.35578
Geodetic CRS: WGS 84
FID OBJECTID featurecla LEVEL TYPE
1 0 1 Admin-0 country 2 Sovereign country
2 1 2 Admin-0 country 2 Sovereign country
3 2 3 Admin-0 country 2 Sovereign country
4 3 4 Admin-0 country 2 Sovereign country
5 4 5 Admin-0 country 2 Sovereign country
6 5 6 Admin-0 country 2 Sovereign country
FORMAL_EN FORMAL_FR POP_EST POP_RANK GDP_MD_EST
1 Republic of Indonesia 260580739 17 3028000
2 Malaysia 31381992 15 863000
3 Republic of Chile 17789267 14 436100
4 Plurinational State of Bolivia 11138234 14 78350
5 Republic of Peru 31036656 15 410400
6 Argentine Republic 44293293 15 879400
POP_YEAR LASTCENSUS GDP_YEAR ECONOMY INCOME_GRP
1 2017 2010 2016 4. Emerging region: MIKT 4. Lower middle income
2 2017 2010 2016 6. Developing region 3. Upper middle income
3 2017 2002 2016 5. Emerging region: G20 3. Upper middle income
4 2017 2001 2016 5. Emerging region: G20 4. Lower middle income
5 2017 2007 2016 5. Emerging region: G20 3. Upper middle income
6 2017 2010 2016 5. Emerging region: G20 3. Upper middle income
FIPS_10_ ISO_A2 ISO_A3 ISO_A3_EH ISO_N3 UN_A3 WB_A2 WB_A3 CONTINENT
1 ID ID IDN IDN 360 360 ID IDN Asia
2 MY MY MYS MYS 458 458 MY MYS Asia
3 CI CL CHL CHL 152 152 CL CHL South America
4 BL BO BOL BOL 068 068 BO BOL South America
5 PE PE PER PER 604 604 PE PER South America
6 AR AR ARG ARG 032 032 AR ARG South America
REGION_UN SUBREGION REGION_WB NAME_AR NAME_BN
1 Asia South-Eastern Asia East Asia & Pacific ????????? ????????????
2 Asia South-Eastern Asia East Asia & Pacific ??????? ???????????
3 Americas South America Latin America & Caribbean ????? ????
4 Americas South America Latin America & Caribbean ??????? ????????
5 Americas South America Latin America & Caribbean ???? ????
6 Americas South America Latin America & Caribbean ????????? ???????????
NAME_DE NAME_EN NAME_ES NAME_FR NAME_EL NAME_HI NAME_HU
1 Indonesien Indonesia Indonesia Indonésie ????????? ?????????? Indonézia
2 Malaysia Malaysia Malasia Malaisie ???????? ??????? Malajzia
3 Chile Chile Chile Chili ???? ???? Chile
4 Bolivien Bolivia Bolivia Bolivie ??????? ???????? Bolívia
5 Peru Peru Perú Pérou ????? ???? Peru
6 Argentinien Argentina Argentina Argentine ????????? ??????????? Argentína
NAME_ID NAME_IT NAME_JA NAME_KO NAME_NL NAME_PL NAME_PT NAME_RU
1 Indonesia Indonesia ?????? ????? Indonesië Indonezja Indonésia ?????????
2 Malaysia Malesia ????? ????? Maleisië Malezja Malásia ????????
3 Chili Cile ?? ?? Chili Chile Chile ????
4 Bolivia Bolivia ???? ???? Bolivia Boliwia Bolívia ???????
5 Peru Perù ??? ?? Peru Peru Peru ????
6 Argentina Argentina ?????? ????? Argentinië Argentyna Argentina ?????????
NAME_SV NAME_TR NAME_VI NAME_ZH WB_NAME WB_RULES WB_REGION
1 Indonesien Endonezya Indonesia ????? Indonesia None EAP
2 Malaysia Malezya Malaysia ???? Malaysia None EAP
3 Chile ?ili Chile ?? Chile None LCR
4 Bolivia Bolivya Bolivia ???? Bolivia None LCR
5 Peru Peru Peru ?? Peru None LCR
6 Argentina Arjantin Argentina ??? Argentina None LCR
Shape_Leng Shape_Area country iso2c year SP.DYN.LE00.IN
1 495.02992 153.07861 Indonesia ID 2020 68.808
2 68.45691 26.70317 Malaysia MY 2020 75.938
3 416.99727 76.76181 Chile CL 2020 79.377
4 54.34599 92.20359 Bolivia BO 2020 64.467
5 73.26219 106.41709 Peru PE 2020 73.665
6 151.51310 278.68107 Argentina AR 2020 75.892
geometry
1 MULTIPOLYGON (((117.7036 4....
2 MULTIPOLYGON (((117.7036 4....
3 MULTIPOLYGON (((-69.51009 -...
4 MULTIPOLYGON (((-69.51009 -...
5 MULTIPOLYGON (((-69.51009 -...
6 MULTIPOLYGON (((-67.28475 -...Step 4: project onto choropleth map
Look how you can do a map.
You can play with many plot parameters to show how scales and themes work.
ggplot(d, aes(fill = SP.DYN.LE00.IN)) +
  geom_sf() +
  coord_sf(crs = 4326) +
  # legend color, title and shape
  scale_fill_viridis_c("Years", guide = guide_legend()) +
  theme_void() +
  theme(
    plot.background = element_rect(fill = "#b3cee5"), # pale light blue
    legend.position = "bottom",
    legend.key.width = unit(1.5, "cm"),
    plot.title = element_text(face = "bold"),
    plot.margin = margin(1 ,1 , 1, 1, "cm")
  ) +
  labs(title = "Life expectancy at birth",
       subtitle = "Data: World Development Indicators, 2020")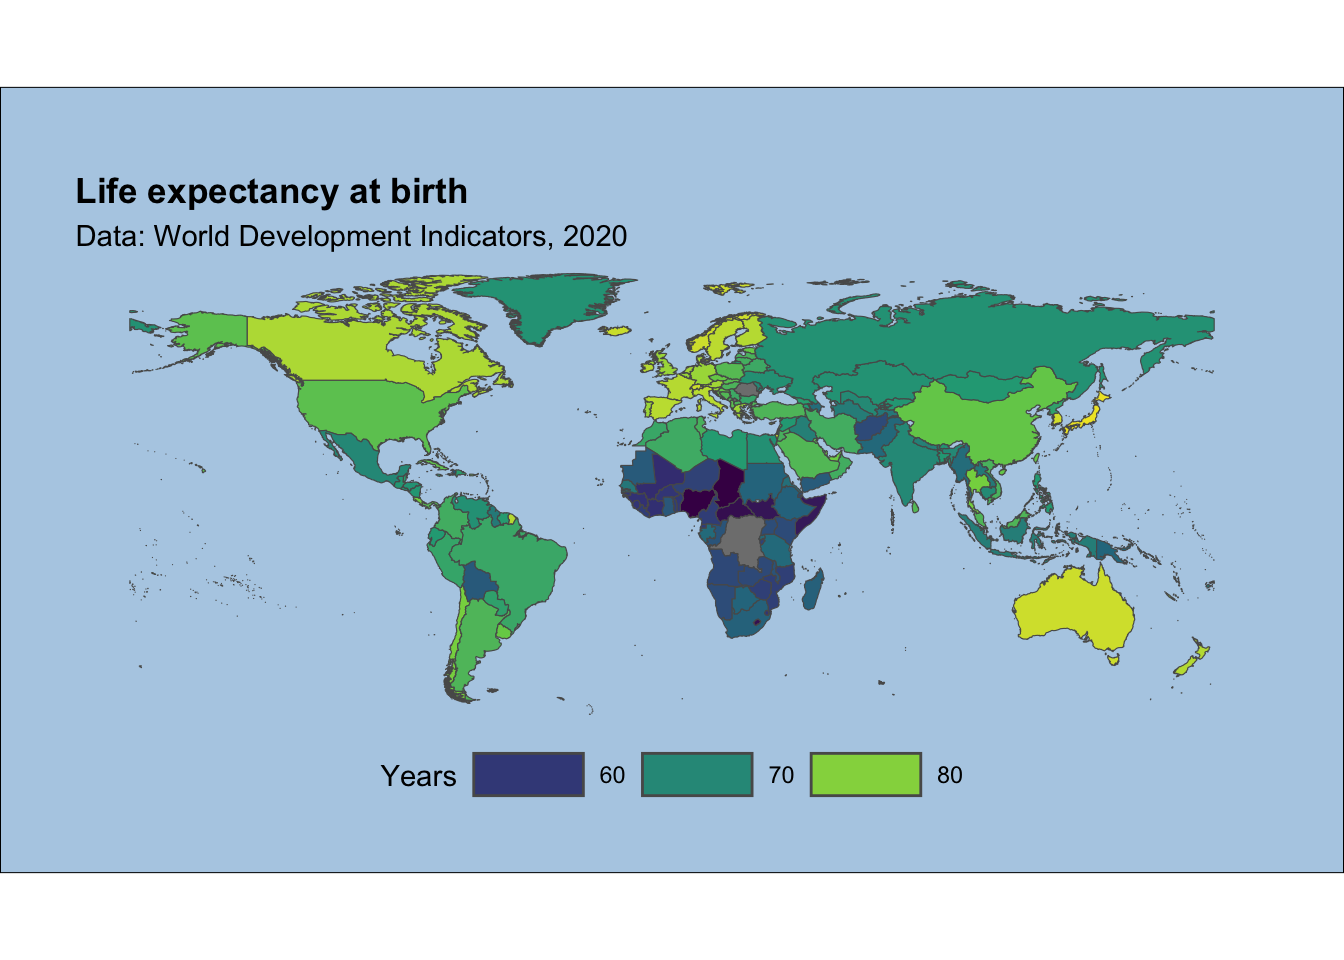
# export with specific dimensions
# ggsave("life-expectancy.png", width = 8, height = 4.5)
Source
Data source for shapefiles: World Bank Official Boundaries.
Data source for life expectancy: World Bank World Development Indicators.
The latter were retrieved with WDI (R package by Vincent Arel-Bundock):
library(WDI)
WDI::WDI(country = "all", indicator = "SP.DYN.LE00.IN", latest = 1) %>%
  write_tsv("data/life-expectancy.tsv")