3 Data 1
Session 3
By the end of this session, you have learned on dplyr tools corresponding to the different steps of data science (data import, tidying, visualization, modeling). In particular, time-consuming nature of data preparation.
In a nutshell
- Importing data from various sources into R.
- Tidying data for consistency and organization.
- Utilizing
dplyrfunctions for data manipulation- renaming variables
- aggregating, grouping by variables
- …
3.1 What you will learn
3.1.1 Key steps in Data Science
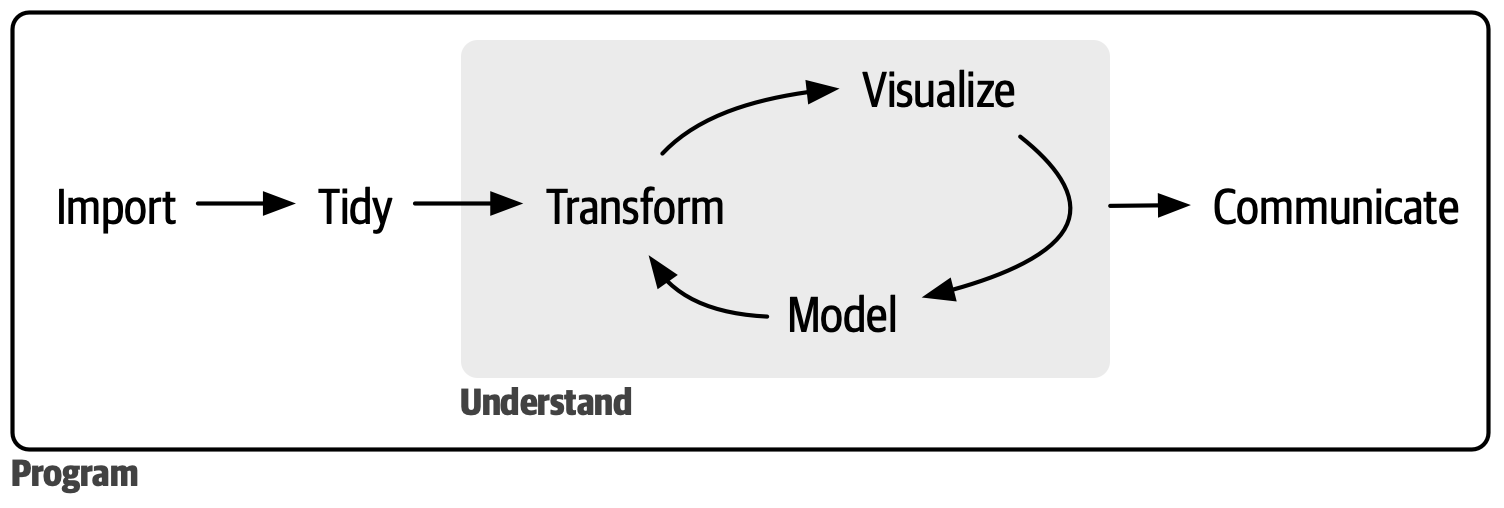
Here are the key steps in data science:
Import Data: Begin by bringing your data into R, which is usually stored in files, databases, or web APIs.
Tidy Data: Organize your data consistently, making sure each column represents a variable and each row corresponds to an observation.
Transform Data: Refine your data by focusing on specific observations, creating new variables, and calculating summary statistics.
Visualization: Use visualizations to uncover unexpected patterns, prompt new questions, and gain insights. However, visualizations may be limited by human interpretation.
Modeling: Employ mathematical or computational models to answer well-defined questions. Models can scale well and provide quantitative insights, but they depend on assumptions.
Communication: Effectively convey your findings to others through clear communication. This step is essential to ensure that insights are understood and actionable.
3.1.2 The importance of data cleaning
A significant portion of the data analysis process involves tasks such as cleaning, transforming, and merging datasets to ensure that the data is in a usable and accurate form.
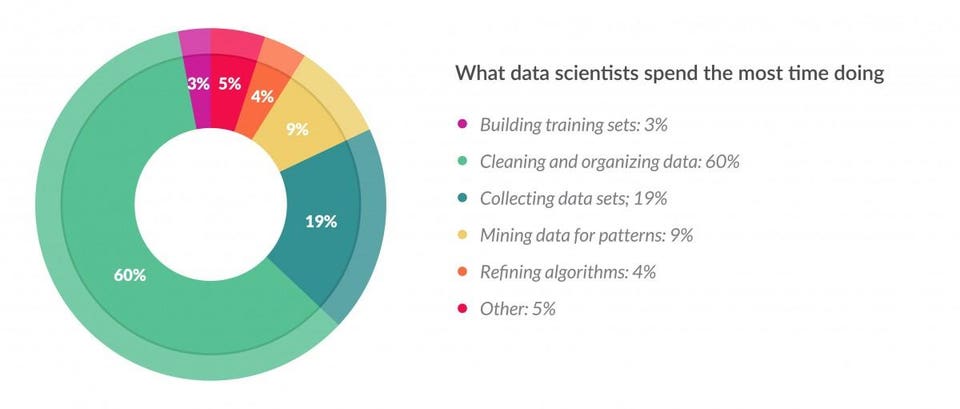
This survey and the article reveal that data preparation to be both the most time-consuming and the least enjoyable task in the data science process. Data professionals spend around 80% on tasks related to cleaning, organizing, and transforming data before it can be analyzed.
3.1.3 Garbage In, Garbage Out
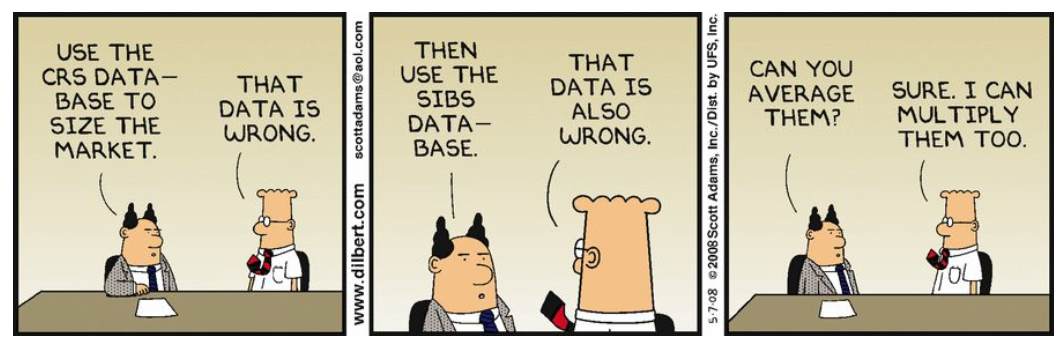
GIGO is a concept in computer science and data analysis that emphasizes the idea that if you input poor quality or incorrect data into a system, the output or results produced by that system will also be of poor quality or incorrect.
This principle underscores the importance of ensuring accurate, reliable, and well-structured data for any data analysis or computational process to yield meaningful and accurate results.
3.2 Get ready to wrangle
3.2.1 Exercise
Exercise 1
Inspiration
Angus Deaton, “COVID-19 and Global Income Inequality”, working paper, January 2021. Later published on that same year as NBER Working Paper No. 28392, and then as an article in the LSE Public Policy Review 1(4): 1-10.
3.2.2 Recap
tidyverse : R packages for data science
The tidyverse is an opinionated collection of R packages designed for data science. All packages share an underlying design philosophy, grammar, and data structures.
Install the complete tidyverse with:
install.packages("tidyverse")dplyr

dplyr provides alternatives to base R functions that apply to data frames it relies on the tibble format, which are enhanced data frames.
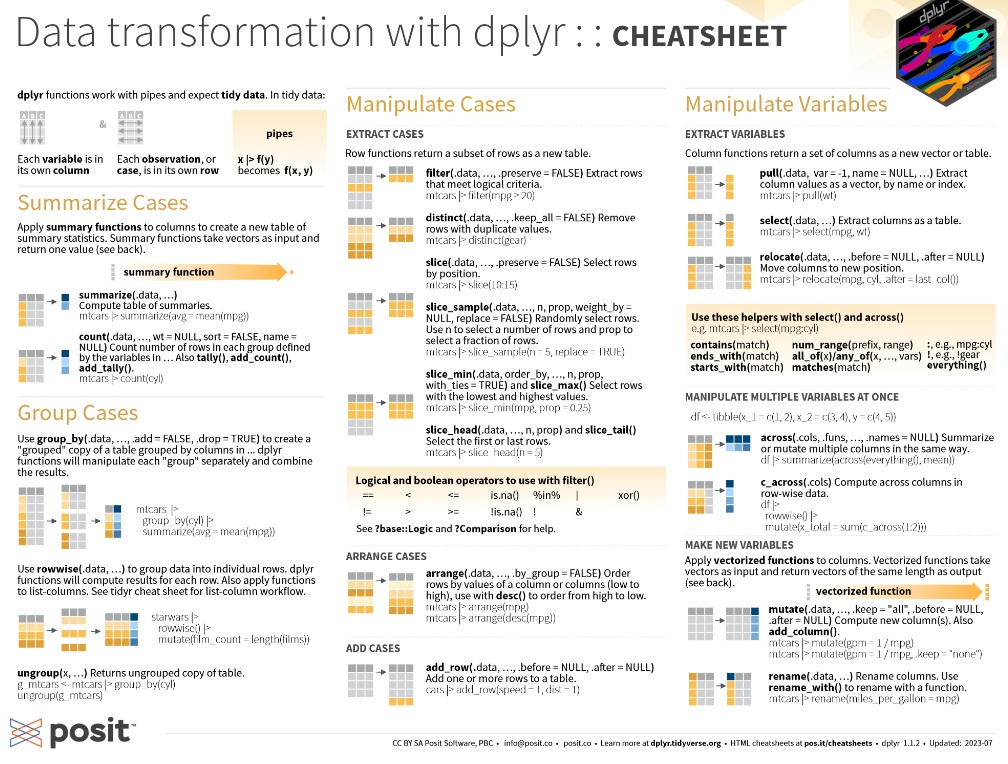
dplyr is a grammar of data manipulation, providing a consistent set of verbs that help you solve the most common data manipulation challenges:
mutate()adds new variables that are functions of existing variablesselect()picks variables based on their names.filter()picks cases based on their values.summarise()reduces multiple values down to a single summary.arrange()changes the ordering of the rows.
These all combine naturally with group_by() which allows you to perform any operation “by group”.
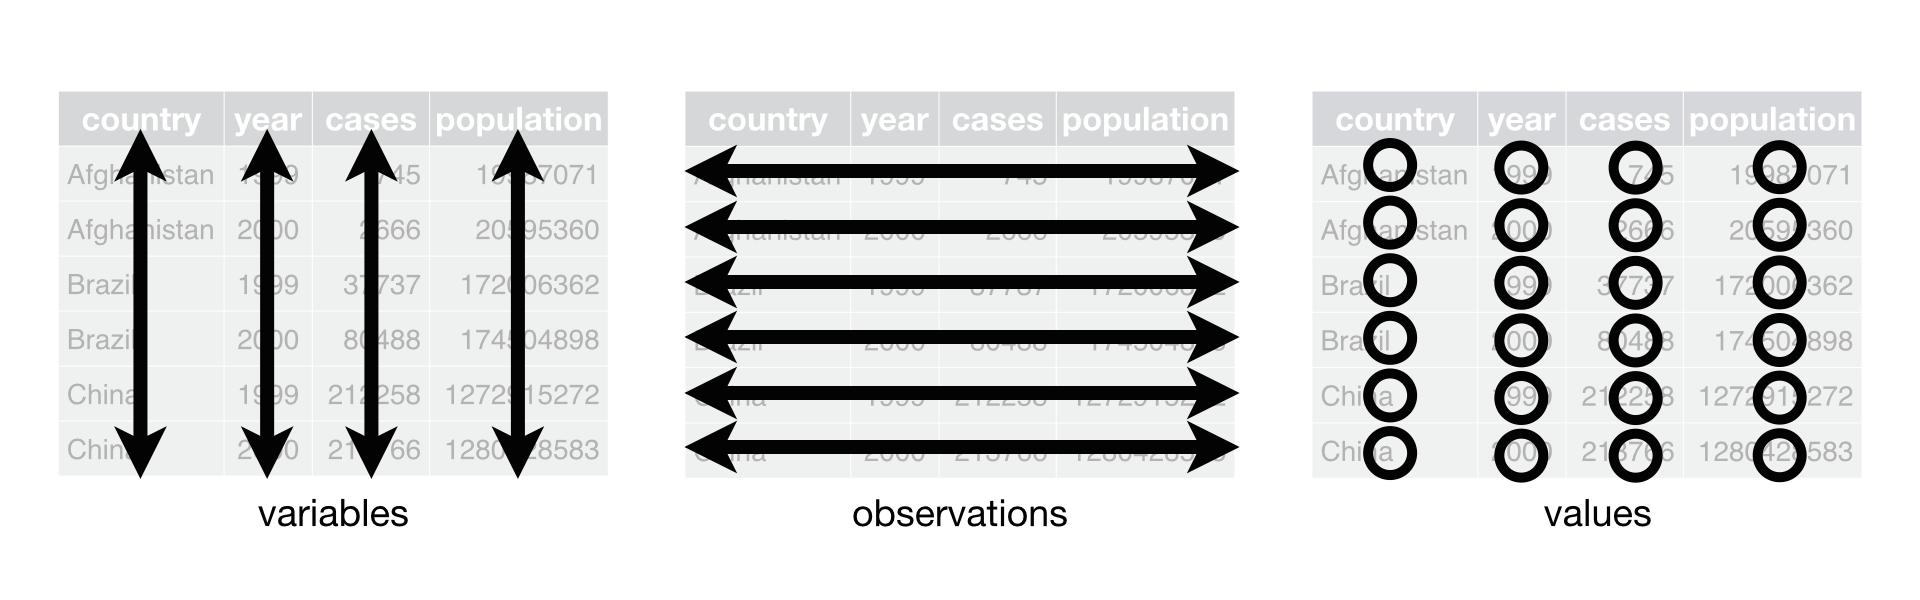
Tidy data (in rectangular data structures)
Like families, tidy datasets are all alike but every messy dataset is messy in its own way. – Hadley Wickham
Each variable must have its own column.
Each observation must have its own row.
Each value must have its own cell.
3.2.3 More Cheatsheets
About the Exams…
Group Exercise n°1 : given on feb. 27th (week 4) for mar. 12th (week 6)
- Mainly data wrangling
Group Exercise n°2 : given on apr. 9th (week 10) for apr. 23th (week 12)
- Datavisualisation and maybe simple econometrics
Individual Feedback : given on apr. 23th (week 12) for may. 7th
- does not involve writing code, but instead focuses on reflecting upon what you did over the course, and what you make out of it at that stage.
Homework for next time (in 2 weeks)
1 preparation exercise (in group & ungraded, for now)
- Use the hints
- Search for help online (e.g. StackOverflow, more than ChatGPT)
- be persistent (you will need it) and do your best!
Handbooks, videos, cheatsheets
- 2 chapters of Irizarry’s handbook
- 2 chapters of Grolemund and Wickham’s handbook
- 2 compulsory Cheatsheets